This exciting work is possible because of a series of aerial photo sets that were collected in 1981 and 1982. By carefully painstakingly georeferencing both 1980's aerial imagery and modern satellite data and comparing these images in the context of the Dolores River, we can measure and quantify the amount and speed of the geomorphic changes.
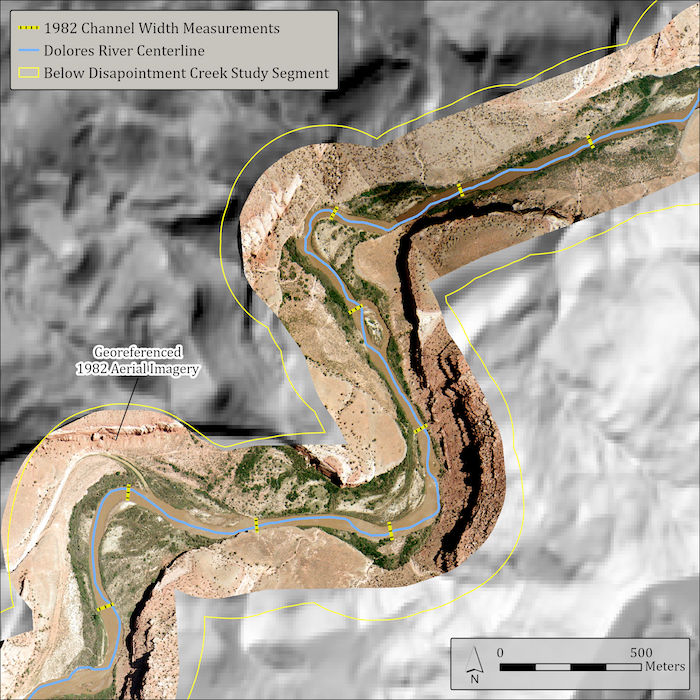
This image demonstrates this process of aerial image analysis. For each aerial imagery data set, a line was drawn to represent the width of the Dolores River every 500 meters (shown in yellow). The lengths of each line were then calculated and organized by study segment.
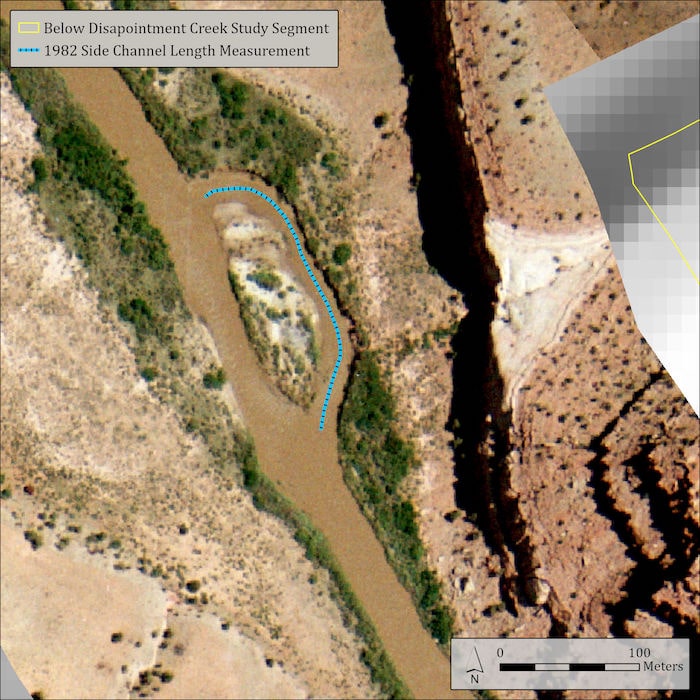
This image shows much the same process used for the channel width measurements, but instead applied to side channel length. Keep in mind that this process was repeated over three to five different datasets for each of the study segments! After all the measurements are compiled, the DRAMS team was able to draw conclusions out of the data, resulting in the analysis presented in this section.